---
title: Observe Codex with Logfire
description: >-
Export Codex sessions to Logfire, then let Codex query app telemetry through
MCP to debug a real PydanticAI regression.
date: '2026-06-01'
authors:
- Petyo Ivanov
categories:
- Pydantic Logfire
- MCP
canonical: 'https://pydantic.dev/articles/codex-logfire-plugins'
---
> Markdown version of [Observe Codex with Logfire](https://pydantic.dev/articles/codex-logfire-plugins) — the canonical HTML page.
>
> By [Petyo Ivanov](https://pydantic.dev/authors/petyo-ivanov.md) · 2026-06-01 · Pydantic Logfire, MCP
>
> Related: [You've built this agent before](https://pydantic.dev/articles/harness-week.md) · [Your traces already know how to fix your prompt](https://pydantic.dev/articles/logfire-prompt-optimization.md)
>
> All articles: [/articles.md](https://pydantic.dev/articles.md) · Site index: [/llms.txt](https://pydantic.dev/llms.txt)
---
# Observe Codex with Logfire
You've felt this one: your coding agent is mid-investigation, it has read half the repo, and then it asks you to paste the stack trace into chat. The production error it needs is sitting in Logfire, but the agent can't see it -- so you become the clipboard.
Coding agents can read your repository, run tests, edit files, and open browsers. They can also fail in all the familiar ways software fails: missing context, stale assumptions, wrong tool choice, and quiet overconfidence. That leaves you with two blind spots.
First, the agent itself is often opaque. You know the final patch, but not always the chain of prompts, tools, commands, and errors that led there. Second, your application telemetry lives somewhere the agent can't reach, so you keep hand-carrying exceptions from the dashboard into the chat.
The new Pydantic Codex plugins close that loop:
- **Logfire Exporter** sends Codex session events and tool calls to Logfire.
- **Logfire** gives Codex skills and tools for querying traces, logs, metrics, and opening the Logfire UI.
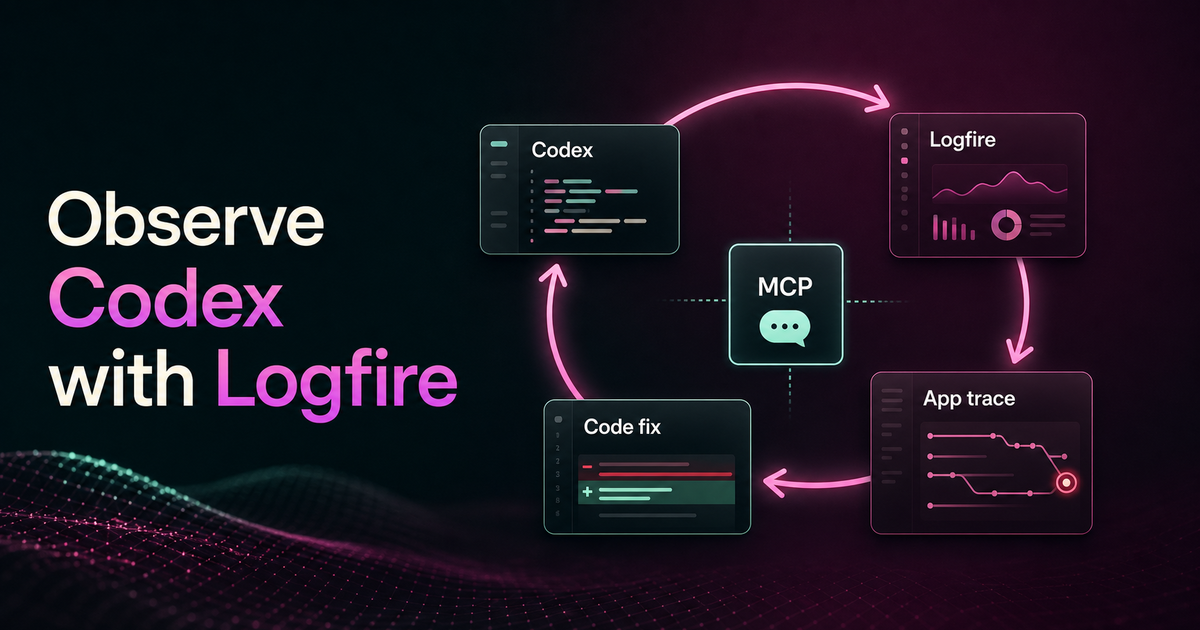
Together, they make a simple workflow possible: Codex can investigate a production-style app failure using Logfire, and the Codex investigation itself is also captured in Logfire.
## Install the plugins
Install the Pydantic skills marketplace in Codex:
```bash
codex plugin marketplace add pydantic/skills
```
Then enable the **Logfire** and **Logfire Exporter** plugins in Codex. They do different jobs, so they have slightly different setup:
- **Logfire Exporter** needs a Logfire write token so it can send Codex turn and tool-call spans to your project.
- **Logfire** installs the Logfire MCP server so Codex can query records, generate trace links, and open Logfire UI views.
For the exporter, either set the token in the shell that launches Codex:
```bash
export LOGFIRE_TOKEN=...
```
or put it in the exporter config file:
```text
~/.config/logfire-exporter/config.env
```
```text
LOGFIRE_TOKEN=...
# Optional; defaults to https://logfire-api.pydantic.dev.
# LOGFIRE_BASE_URL=https://...
```
After enabling the exporter, restart Codex so the hook configuration is loaded. If Codex asks you to review the plugin hooks, run `/hooks` and approve them. The exporter listens to Codex lifecycle hooks, stores lightweight turn fragments locally during the turn, and exports the completed turn on the `Stop` hook. In other words, the first Logfire trace appears after a Codex turn finishes, not when Codex starts.
For the Logfire plugin, authenticate the MCP connection as you normally would for Logfire, using `logfire auth` or a suitable `LOGFIRE_TOKEN`. The plugin is configured for the US MCP endpoint by default; EU users can replace the MCP entry and re-authenticate:
```bash
codex mcp remove logfire
codex mcp add logfire --url https://logfire-eu.pydantic.dev/mcp
codex mcp login logfire
codex mcp get logfire
```
See the [`pydantic/skills`](https://github.com/pydantic/skills) repository for the full plugin READMEs and local-development setup.
:::note{title="Content capture"} By default, the exporter runs with `CODEX_LOGFIRE_CONTENT_CAPTURE_MODE=full`, which records redacted user prompts, assistant messages, tool inputs, tool outputs, and tool errors. Use `no_tool_content` to keep prompt and assistant content but omit tool input/output, or `metadata_only` to suppress prompt, assistant, and tool content entirely. Start with the default while testing locally, then choose the capture mode that matches your security policy before rolling it out to a team. :::
## The demo: one bug, two telemetry streams
For this post, we used [`pydantic/logfire-demo`](https://github.com/pydantic/logfire-demo), a small distributed demo app with a FastAPI web UI, an `arq` worker, Postgres, pgvector, PydanticAI agents, and Logfire instrumentation already wired in.
The bug is real. In January 2026, the demo fixed a PydanticAI result API mismatch in [PR #65](https://github.com/pydantic/logfire-demo/pull/65): code that read `response.data` needed to read `response.output`.
For the recording, we did not check out old commits. We started from current `main`, created a dedicated branch, and reintroduced that one-line regression in the worker:
```python
response = await ctx['ai_agent'].run(question)
logfire.info('Question: {question} Answer: {response}', question=question, response=response.data)
```
That gives us a stable current dependency set while still showing Codex investigate a genuine historical regression.
## Watch Codex work
The first half of the loop is agent observability. When the Logfire Exporter plugin is enabled, a Codex session becomes trace data.
In Logfire, a single Codex turn can include spans for:
- The submitted user prompt.
- Shell commands and other tool calls.
- Tool results, depending on content capture mode.
- Session lifecycle events.
That matters when an agent produces a surprising patch. You can inspect what it searched, which commands failed, which files it read, and what the final answer was grounded in.
Code review tells you whether the patch is right. This tells you how the agent got there -- the audit trail around the work.
## Let Codex query the app
The second half of the loop is application debugging. Codex should not need you to copy an exception from a dashboard into the chat. It should be able to ask Logfire directly.
For the demo, the prompt is intentionally plain:
```text
The LLM Query worker started failing after the last change.
Find the most recent exception and tell me which file to fix.
```
What's useful here is that Codex earns the answer rather than recalling it. It queries the telemetry, finds the exception, connects it to the worker code, and points to the file that contains the bad result access.
The same investigation can be expressed as SQL when you want to inspect the underlying telemetry yourself:
```sql
SELECT
start_timestamp,
trace_id,
service_name,
span_name,
exception_type,
exception_message
FROM records
WHERE is_exception = true
AND service_name = 'worker'
ORDER BY start_timestamp DESC
LIMIT 20
```
The exact query is less important than the shape of the workflow:
1. Start from a symptom.
2. Ask Logfire for the most recent relevant failure.
3. Follow the trace to the file and line.
4. Patch the code.
5. Verify the error disappears.
This is the same debugging loop you would run manually, but with less copy-paste and fewer guesses.
## Open Logfire inside Codex
Sometimes you want analysis, but sometimes, you would rather explore what's going on in the UI of Logfire. The Logfire plugin separates those routes. If you ask Codex to investigate an error, it should query telemetry and summarize what it found. If you ask it to open certain records in Logfire, it should open the right view in the Codex in-app browser.
For example:
```text
Open the Logfire live view for errors in this project over the last hour.
```
Then, after the page is open:
```text
Narrow it to the worker service only.
```
The second prompt updates the browser view instead of starting a separate investigation. That matters during a debugging session because the UI stays in the same workspace as the code and the agent chat.
Codex opens Logfire, filters to the worker failure, and reveals the traceback that points to the stale PydanticAI result access.
Use this split as a rule of thumb:
| User intent | Route |
| ----------------------------------- | ------------------------------------- |
| "Why is this failing?" | Query Logfire and analyze the results |
| "Find the most recent exception" | Query Logfire and cite the trace |
| "Open this trace" | Open the Logfire UI |
| "Show me errors from the last hour" | Open the Logfire live view |
## Why this works
There is no bespoke integration between Codex and Logfire. Two independent layers happen to meet on the same telemetry:
- **OpenTelemetry** defines the wire format and the GenAI semantic conventions, so a Codex session, a FastAPI request, and a PydanticAI agent call all describe themselves the same way.
- **Logfire** ingests that data and stores it as queryable records, whether it came from your application or from the Codex session itself.
Because the agent's work and the app's behavior land in the same project as the same kind of spans, Codex can query the substrate it runs on. The investigation and the thing being investigated share one table. That is what makes the loop close, rather than the two halves merely touching at the ends.
## Which plugin should you enable?
The two plugins are useful separately, but they are strongest together.
| Setup | Use it when |
| --------------------- | ----------------------------------------------------------------------------------- |
| Logfire Exporter only | You want an audit trail of Codex sessions and tool calls |
| Logfire only | You want Codex to query existing Logfire telemetry and open Logfire UI links |
| Both | You want one loop: the agent can debug your app, and the agent's work is traced too |
If you already use Logfire for your application, the Codex integration is a natural next step. Your app traces, your agent investigation, and the UI view can all live in the same project.
## What to try next
Install the Pydantic Codex plugins from [`pydantic/skills`](https://github.com/pydantic/skills), enable Logfire Exporter for a local Codex session, and run one real debugging task with Logfire connected.
You do not need to turn your whole workflow over to an agent. Start with one incident. Let Codex find the trace, read the relevant file, and propose the fix. Then review it like any other patch.
That is the point: not magic debugging, just better plumbing between the code, the telemetry, and the tool doing the work.